Database List
The list view aggregates summary information across all of your databases.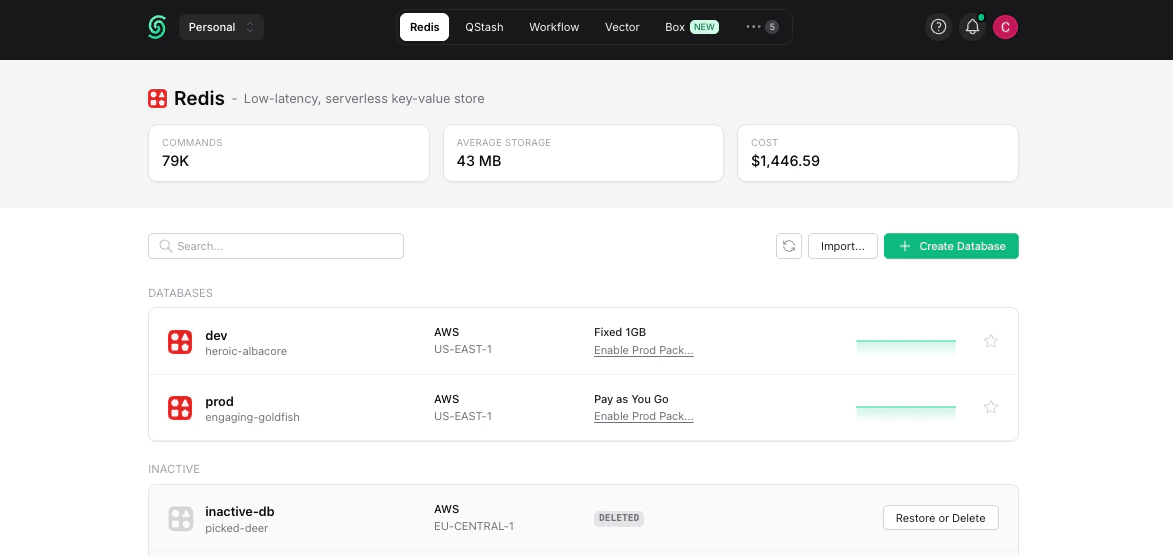
- The region of the database
- The plan of the database (free, pay-as-you-go, fixed, or enterprise)
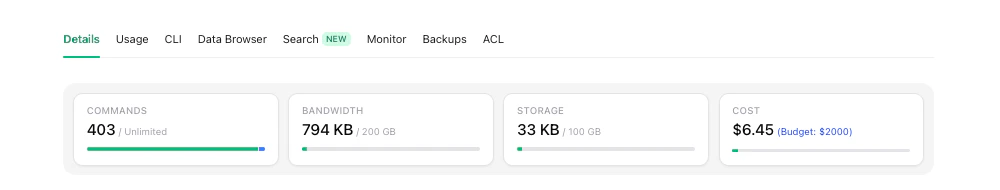
Database Details
By clicking on a database on the list page, you can navigate to its detail page. The charts on this page show metrics that are specific to the selected database.Current Month
Daily Request
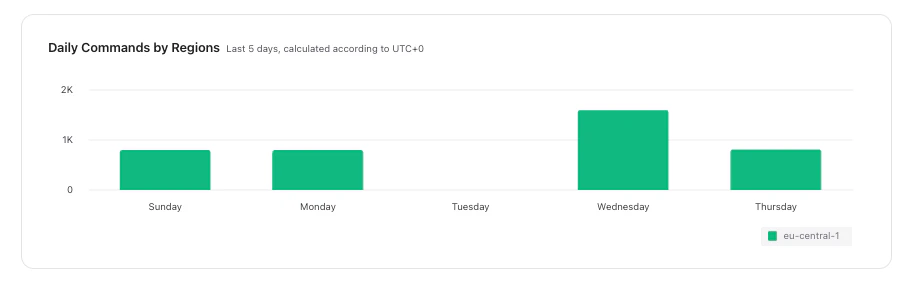
Database Usage
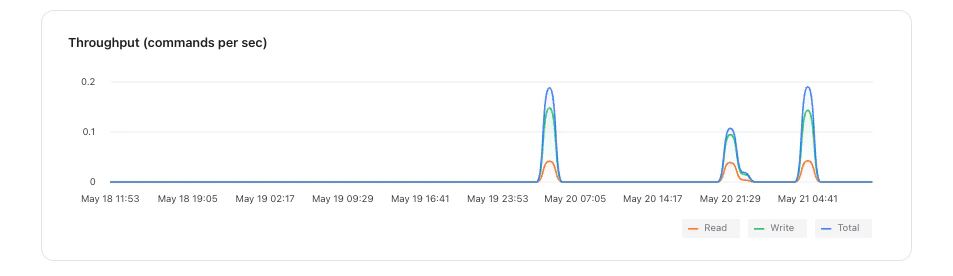
If you click on the “Usage” tab, you can see more detailed charts about the usage of your database.Throughput
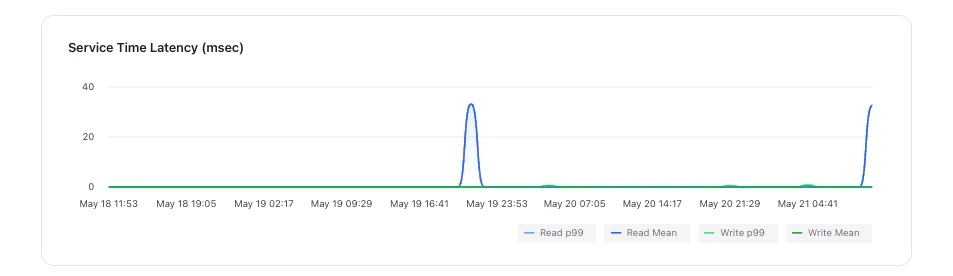
Service Time Latency
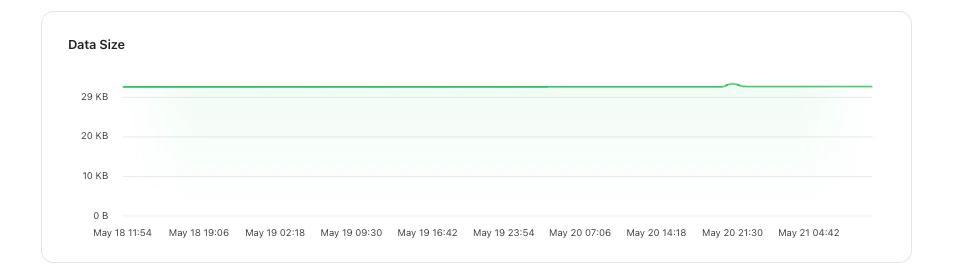
Data Size
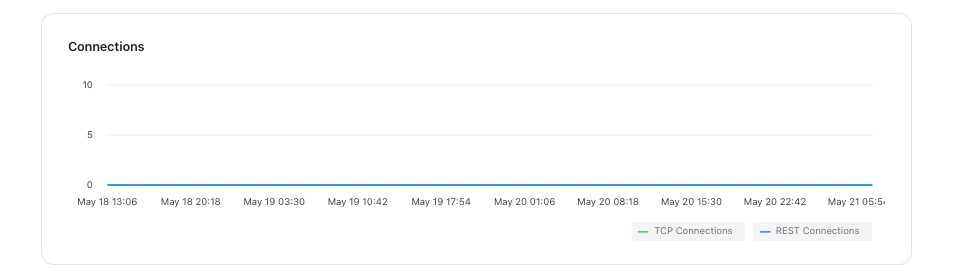
Connections
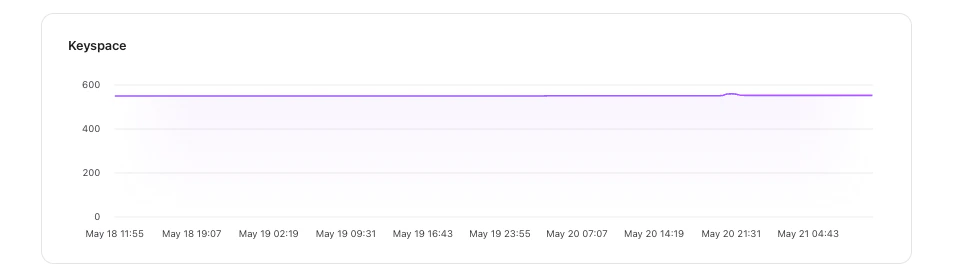
Key Space
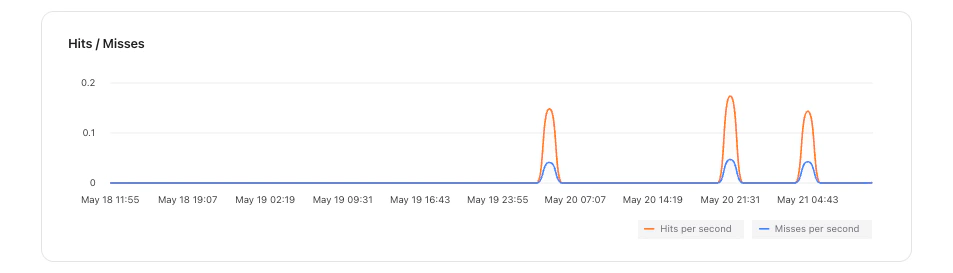
Hits / Misses